Tracing with OpenTelemetry
Tracing in Fission
Tracing gives you a request-level view of how a call flows through Fission’s components — router, executor, function pod — and how long each step takes.
Fission instruments its components with OpenTelemetry and exports spans over OTLP to any compatible backend. Earlier releases used OpenTracing/Jaeger directly. OpenTelemetry has replaced that path and is the only tracing system Fission ships today. Because OpenTelemetry speaks OTLP, you can still send traces to Jaeger (shown below) or to any vendor that accepts OTLP.
OpenTelemetry
OpenTelemetry is a set of APIs, SDKs, and integrations for creating and managing telemetry data — traces, metrics, and logs. The project provides a vendor-agnostic implementation you can configure to send telemetry data to the backend(s) of your choice. It supports a variety of popular open-source projects including Jaeger and Prometheus.
Fission OpenTelemetry Integration
If you have OpenTelemetry installed, you can use it to collect traces and metrics from Fission.
The openTelemetry section in the Helm chart configures the OpenTelemetry SDK used by the Fission components.
The chart translates each value into a standard OTEL_* environment variable and injects it into every component pod.
These variables also propagate to function pods.
| Helm value | Environment variable | Description |
|---|---|---|
openTelemetry.otlpCollectorEndpoint | OTEL_EXPORTER_OTLP_ENDPOINT | Collector endpoint for OpenTelemetry (host:port). Tracing is disabled when this is empty. |
openTelemetry.otlpInsecure | OTEL_EXPORTER_OTLP_INSECURE | true/false; whether to skip TLS for the collector connection |
openTelemetry.otlpHeaders | OTEL_EXPORTER_OTLP_HEADERS | Comma-separated key-value pairs sent as headers on gRPC/HTTP export requests |
openTelemetry.tracesSampler | OTEL_TRACES_SAMPLER | Sampler for traces |
openTelemetry.tracesSamplingRate | OTEL_TRACES_SAMPLER_ARG | Argument for the sampler |
openTelemetry.propagators | OTEL_PROPAGATORS | Kept for chart compatibility. Fission components always propagate with W3C Trace Context + Baggage and do not honor other values — see Trace propagation. |
openTelemetry.logsEnabled | OTEL_LOGS_ENABLED | true/false (default false). When enabled alongside a collector endpoint, control-plane components also push their structured logs (carrying trace_id) to the OTLP collector, not just traces. |
openTelemetry.metricsExporter | OTEL_METRICS_EXPORTER | Metrics exporter selection (default prometheus). The Prometheus /metrics scrape always stays on; set otlp (or prometheus,otlp) to also push metrics over OTLP to the collector. |
Without a configured collector endpoint, you cannot visualize traces.
Depending on your sampler configuration, you can still observe trace_id in Fission component logs.
Search by trace_id across Fission service logs to debug a specific request.
Since v1.27.0 the head sampler comes fromOTEL_TRACES_SAMPLER/OTEL_TRACES_SAMPLER_ARG(these were previously ignored). Fission always exports spans for failed invocations regardless of the sampler decision, so error traces are never dropped. With the chart default (parentbased_traceidratioat0.1), successful-trace export drops to 10% while every error trace is kept; setOTEL_TRACES_SAMPLER=parentbased_always_onto export 100%.
Many observability platforms — DataDog, Dynatrace, Honeycomb, Lightstep, New Relic, Signoz, Splunk, and others — support OpenTelemetry out of the box.
Use otlpHeaders to configure the headers those platforms require, and you can send traces to them directly without standing up an OpenTelemetry Collector yourself.
If none of the above options work, open an issue or a pull request.
Types of samplers
Set OTEL_TRACES_SAMPLER to one of the following:
| Sampler | Behavior |
|---|---|
always_on | Treated the same as parentbased_always_on. |
always_off | Treated the same as parentbased_always_off. |
traceidratio | Samples probabilistically based on rate. |
parentbased_always_on | Respects the parent span’s sampling decision, but otherwise always samples. Default if OTEL_TRACES_SAMPLER is empty. |
parentbased_always_off | Respects the parent span’s sampling decision, but otherwise never samples. |
parentbased_traceidratio | Respects the parent span’s sampling decision, but otherwise samples probabilistically based on rate. Default in the chart. |
An unknown sampler value falls back to parentbased_always_on.
Sampler arguments
Only traceidratio and parentbased_traceidratio take an argument, set via OTEL_TRACES_SAMPLER_ARG: a sampling probability in the [0..1] range, e.g. "0.1".
Default is 0.1.
Trace propagation
Fission components propagate trace context with the W3C Trace Context and Baggage propagators.
Fission does not honor other propagator types (b3, b3multi, jaeger, xray, ottrace).
It dropped the non-W3C propagator modules to reduce the binary footprint.
The openTelemetry.propagators value still injects OTEL_PROPAGATORS into every pod, so a function running its own OpenTelemetry SDK can read it.
Fission’s own components ignore it, though.
Sample OTEL Collector
This example uses the OpenTelemetry Operator for Kubernetes to set up the OTEL collector.
Installing the operator in an existing cluster requires cert-manager.
Use the following commands to install cert-manager and the operator:
# cert-manager
kubectl apply -f https://github.com/jetstack/cert-manager/releases/latest/download/cert-manager.yaml

# open telemetry operator
kubectl apply -f https://github.com/open-telemetry/opentelemetry-operator/releases/latest/download/opentelemetry-operator.yaml
Once the opentelemetry-operator deployment is ready, create an OpenTelemetry Collector instance.
The following configuration is a good starting point. Change it as needed:
kubectl apply -f - <<EOF
apiVersion: v1
kind: ConfigMap
metadata:
  name: otel-collector-conf
  namespace: opentelemetry-operator-system
  labels:
    app: opentelemetry
    component: otel-collector-conf
data:
  otel-collector-config: |
    receivers:
      # Add the otlp receiver.
      # This opens the receiver on port 4317.
      otlp:
        protocols:
          grpc:
            endpoint: "0.0.0.0:4317"
    processors:
      memory_limiter:
        check_interval: 5s
        limit_mib: 1500
        spike_limit_mib: 512
      batch: {}
    extensions:
      health_check:
        endpoint: "0.0.0.0:13133"
    exporters:
      # Jaeger accepts OTLP natively since v1.35, so export over OTLP
      # instead of the old jaeger exporter, which current collector
      # builds no longer ship.
      otlp/jaeger:
        endpoint: "jaeger-collector.observability.svc.cluster.local:4317"
        tls:
          insecure: true
      debug: {}

    service:
      extensions: [health_check]
      pipelines:
        traces:
          receivers: [otlp]
          processors: [memory_limiter, batch]
          exporters: [otlp/jaeger, debug]
---
apiVersion: v1
kind: Service
metadata:
  name: otel-collector
  namespace: opentelemetry-operator-system
  labels:
    app: opentelemetry
    component: otel-collector
spec:
  ports:
    - name: otlp # Default endpoint for the otlp receiver.
      port: 4317
      protocol: TCP
      targetPort: 4317
      nodePort: 30080
  selector:
    component: otel-collector
  type: NodePort
---
apiVersion: apps/v1
kind: Deployment
metadata:
  name: otel-collector
  namespace: opentelemetry-operator-system
  labels:
    app: opentelemetry
    component: otel-collector
spec:
  selector:
    matchLabels:
      app: opentelemetry
      component: otel-collector
  minReadySeconds: 5
  progressDeadlineSeconds: 120
  replicas: 1 # increase for higher trace throughput or collector high availability
  template:
    metadata:
      labels:
        app: opentelemetry
        component: otel-collector
    spec:
      containers:
        - command:
            - "/otelcol"
            - "--config=/conf/otel-collector-config.yaml"
          env:
            # GOMEMLIMIT replaces the old --mem-ballast-size-mib flag,
            # which current collector builds no longer accept.
            # Set it to about 80% of the memory limit below.
            - name: GOMEMLIMIT
              value: "1600MiB"
          image: otel/opentelemetry-collector:0.158.0
          name: otel-collector
          resources:
            limits:
              cpu: 1
              memory: 2Gi
            requests:
              cpu: 200m
              memory: 400Mi
          ports:
            - containerPort: 4317 # Default endpoint for the otlp receiver.
          volumeMounts:
            - name: otel-collector-config-vol
              mountPath: /conf
          # - name: otel-collector-secrets
          #   mountPath: /secrets
          livenessProbe:
            httpGet:
              path: /
              port: 13133 # Health Check extension default port.
          readinessProbe:
            httpGet:
              path: /
              port: 13133 # Health Check extension default port.
      volumes:
        - configMap:
            name: otel-collector-conf
            items:
              - key: otel-collector-config
                path: otel-collector-config.yaml
          name: otel-collector-config-vol
EOF
The image tag above (0.158.0) was current at the time of writing.
Check the available tags for a newer release before you deploy.
This example uses the core otel/opentelemetry-collector image, which already includes the OTLP receiver, OTLP exporter, and health-check extension this pipeline needs.
Use the -contrib image only if you add components it does not ship, such as vendor-specific receivers or exporters.
Note: the configuration above adapts the OpenTelemetry Collector Kubernetes example, with minor changes.
Jaeger
This example uses the Jaeger Operator for Kubernetes to deploy Jaeger. To install the operator, run:
kubectl create namespace observability
kubectl create -n observability -f https://github.com/jaegertracing/jaeger-operator/releases/download/v1.39.0/jaeger-operator.yaml
If you use a namespace other than observability, download and customize the Role Bindings.
Once the jaeger-operator deployment in the observability namespace is ready, create a Jaeger instance:
kubectl apply -n observability -f - <<EOF
apiVersion: jaegertracing.io/v1
kind: Jaeger
metadata:
  name: jaeger
EOF
The jaeger-operator enables the collector’s OTLP receiver by default.
No extra flag is needed for jaeger-collector to accept the OTLP traffic from the OTEL collector on ports 4317 (gRPC) and 4318 (HTTP).
Check that the otel-collector and jaeger-query services exist:
kubectl get svc --all-namespaces

NAMESPACE                       NAME                                                        TYPE        CLUSTER-IP      EXTERNAL-IP   PORT(S)                                  AGE
cert-manager                    cert-manager                                                ClusterIP   10.96.228.4     <none>        9402/TCP                                 7m50s
cert-manager                    cert-manager-webhook                                        ClusterIP   10.96.214.220   <none>        443/TCP                                  7m50s
default                         kubernetes                                                  ClusterIP   10.96.0.1       <none>        443/TCP                                  9m35s
kube-system                     kube-dns                                                    ClusterIP   10.96.0.10      <none>        53/UDP,53/TCP,9153/TCP                   9m33s
observability                   jaeger-agent                                                ClusterIP   None            <none>        5775/UDP,5778/TCP,6831/UDP,6832/UDP      3s
observability                   jaeger-collector                                            ClusterIP   10.96.48.27     <none>        9411/TCP,14250/TCP,14267/TCP,14268/TCP,4317/TCP,4318/TCP   3s
observability                   jaeger-collector-headless                                   ClusterIP   None            <none>        9411/TCP,14250/TCP,14267/TCP,14268/TCP,4317/TCP,4318/TCP   3s
observability                   jaeger-operator-metrics                                     ClusterIP   10.96.164.206   <none>        8383/TCP,8686/TCP                        61s
observability                   jaeger-query                                                ClusterIP   10.96.186.29    <none>        16686/TCP,16685/TCP                      3s
opentelemetry-operator-system   opentelemetry-operator-controller-manager-metrics-service   ClusterIP   10.96.29.83     <none>        8443/TCP                                 6m11s
opentelemetry-operator-system   opentelemetry-operator-webhook-service                      ClusterIP   10.96.74.0      <none>        443/TCP                                  6m11s
opentelemetry-operator-system   otel-collector                                              NodePort    10.96.107.99    <none>        4317:30080/TCP                           2m22s
Set up a port forward to the jaeger-query service:
kubectl port-forward service/jaeger-query -n observability 8080:16686 &
Access Jaeger at http://localhost:8080/.
Installing Fission
Fission does not enable OpenTelemetry by default.
To enable it, explicitly set openTelemetry.otlpCollectorEndpoint to your collector’s address:
export FISSION_NAMESPACE=fission
helm install --namespace $FISSION_NAMESPACE \
  fission fission-charts/fission-all \
  --set openTelemetry.otlpCollectorEndpoint="otel-collector.opentelemetry-operator-system.svc:4317" \
  --set openTelemetry.otlpInsecure=true \
  --set openTelemetry.tracesSampler="parentbased_traceidratio" \
  --set openTelemetry.tracesSamplingRate="1"
Change openTelemetry.otlpCollectorEndpoint to match your setup.
Testing
To verify the setup and confirm traces are being received, deploy and test a Fission function. This test uses a simple NodeJS-based function.
# create an environment
fission env create --name nodejs --image ghcr.io/fission/node-env

# get hello world function
curl https://raw.githubusercontent.com/fission/examples/main/nodejs/hello.js > hello.js

# register the function with Fission
fission function create --name hello --env nodejs --code hello.js

# run the function
fission function test --name hello
hello, world!
Traces with Jaeger
If you followed along, access Jaeger at http://localhost:8080/.
Refresh the page.
Multiple services appear in the Service dropdown.
Select the Fission-Router and click the Find Traces button.
The spans for the function request you just tested appear.
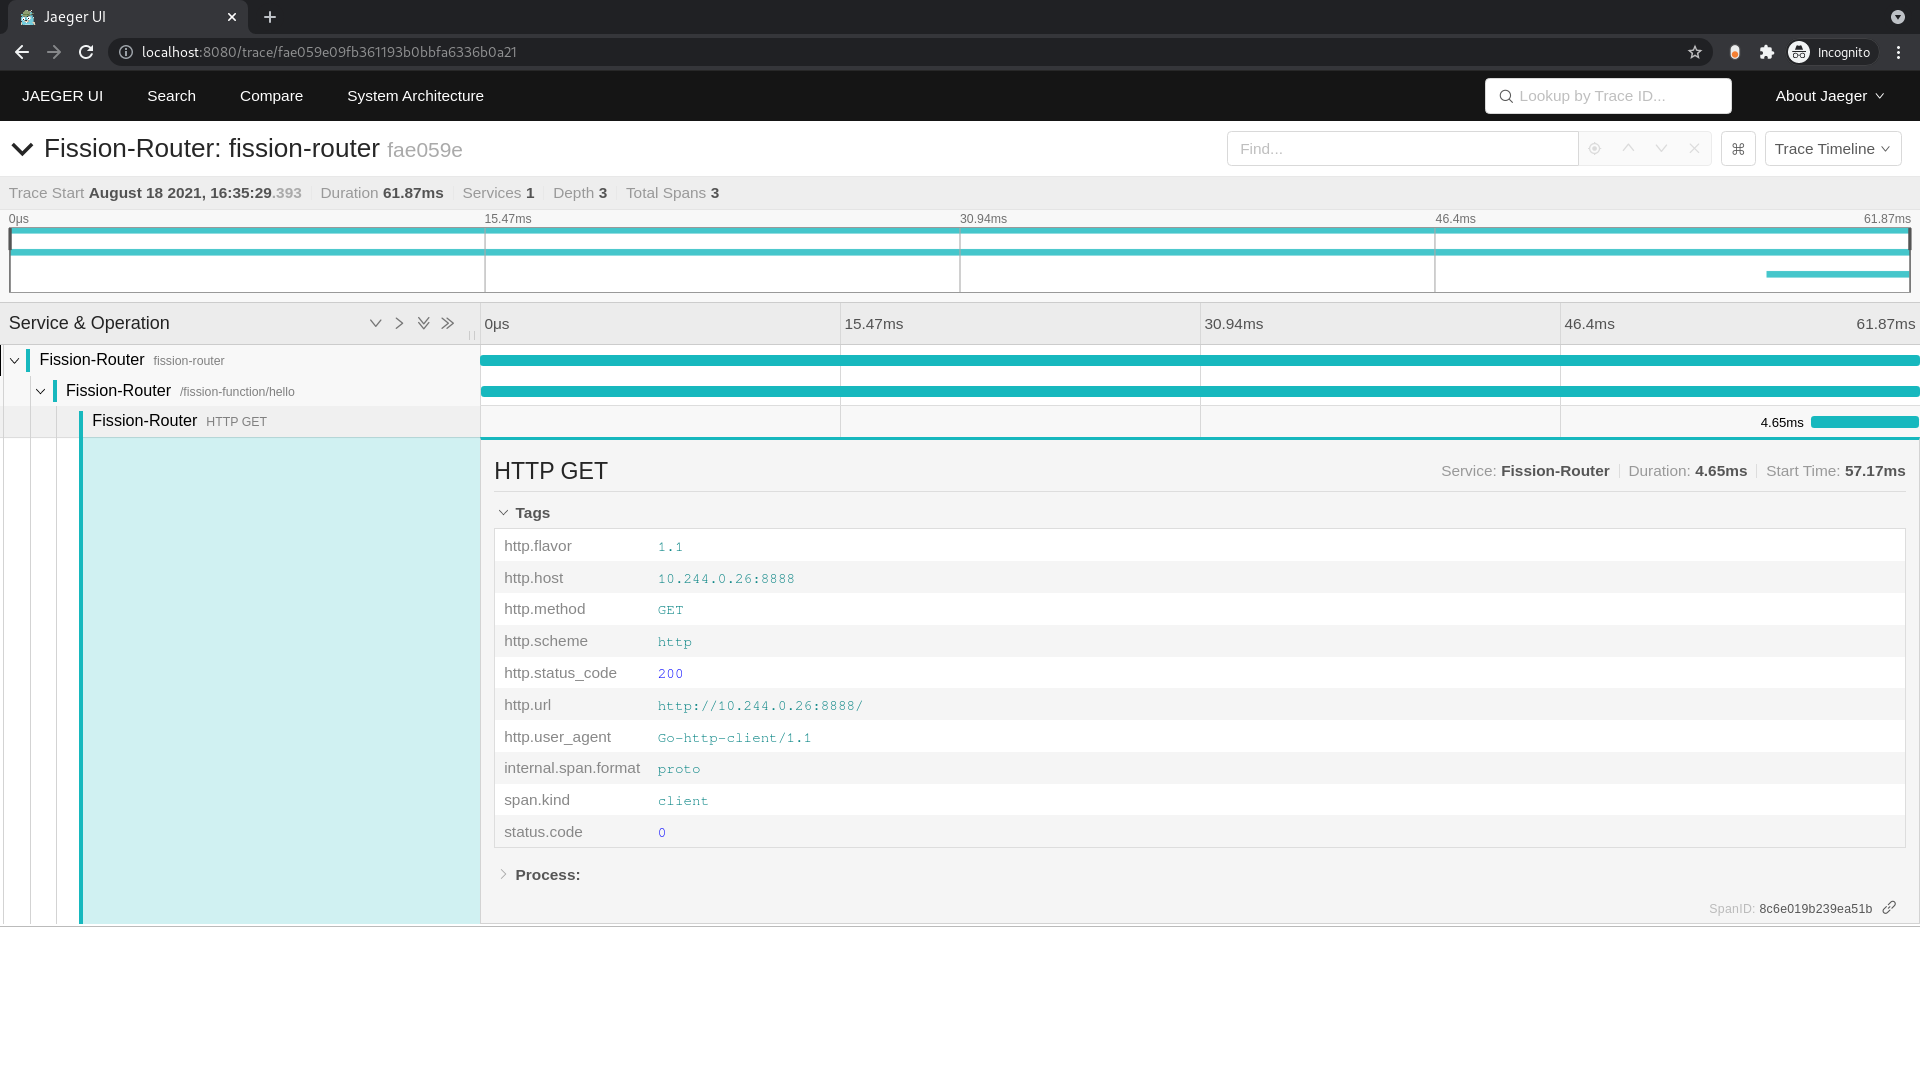
Select the trace and on the next page expand the spans.
The request flow looks similar to the one below:
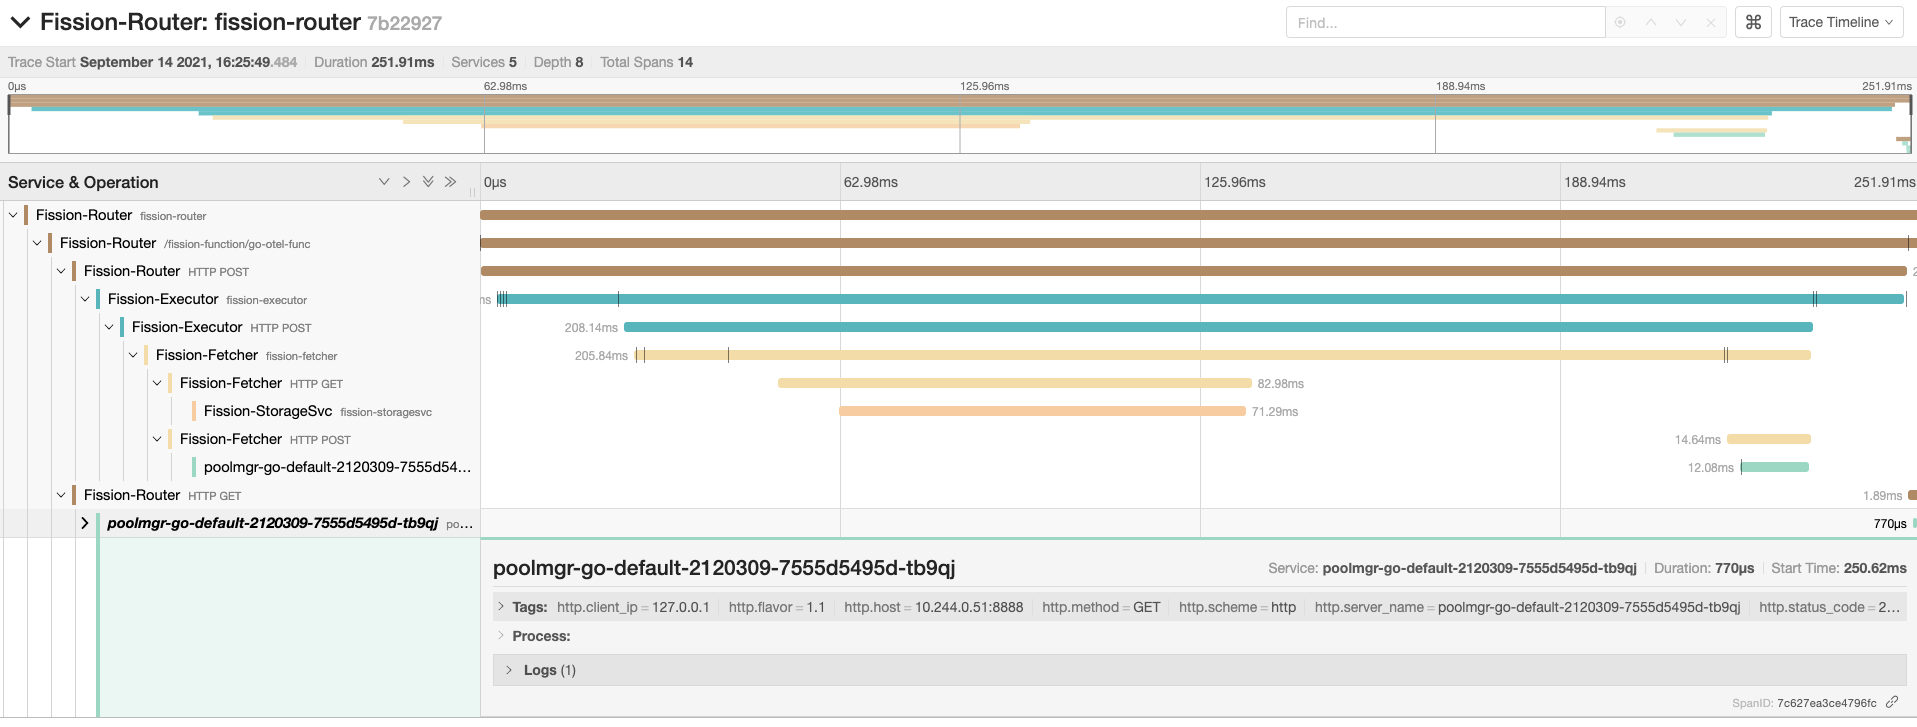
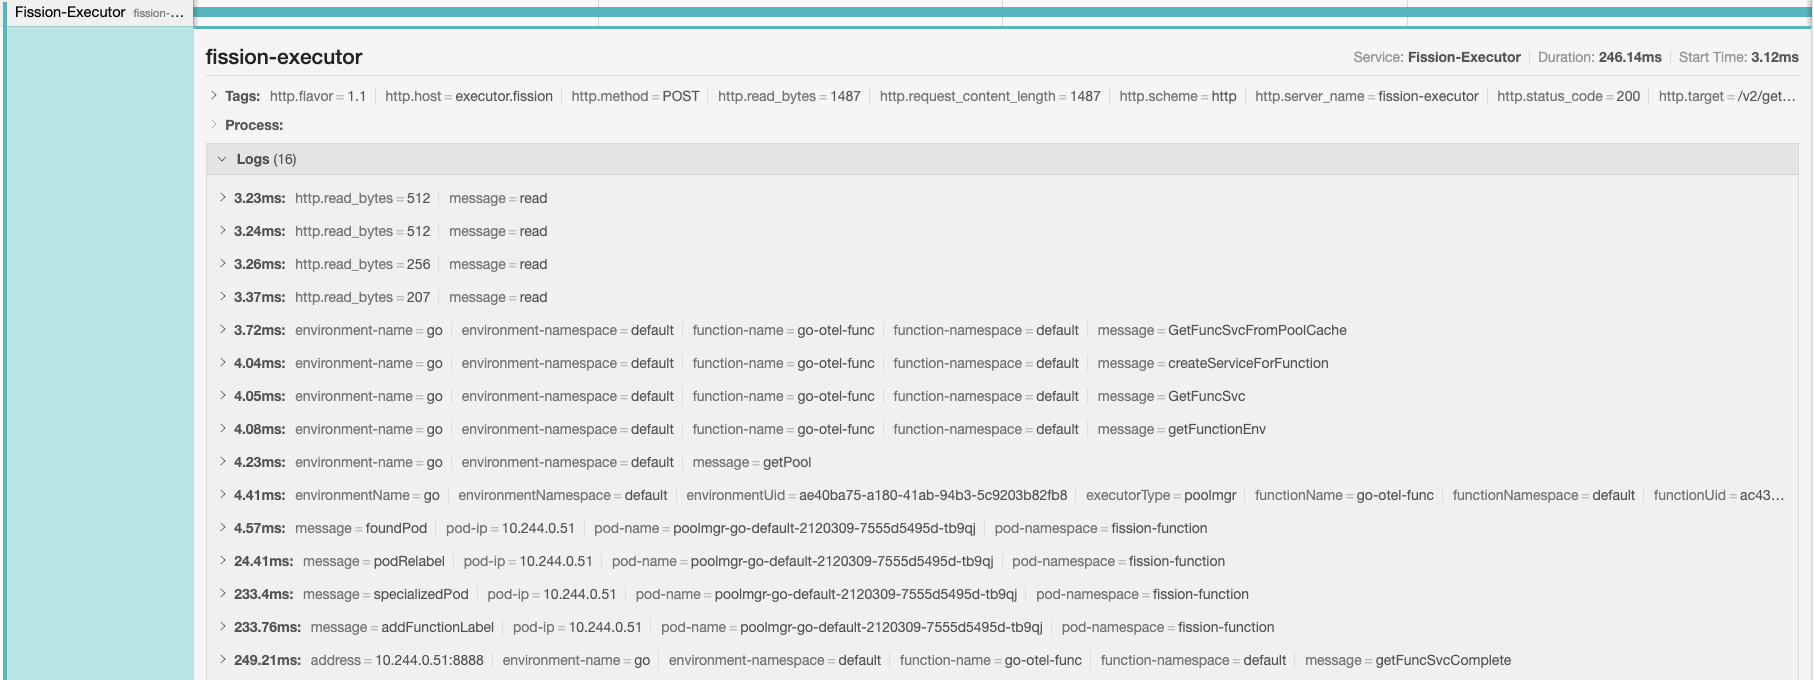
If you enable OpenTelemetry tracing within your function, you can capture spans and events for the function request.
These are sample spans and events from invoking a Go-based function: